
Home » The Difference Between a Good Year and a Good Decade
Most of the wealth management industry is organised around a simple question: What performed well this year?
It’s why quarterly rankings exist. Why do “top funds of 2025” lists proliferate in January? Why advisors talk about “beating the market” as if portfolios were designed for scorekeeping rather than stewardship.
But families building wealth across generations need to ask a different question: What will serve us well over the next decade, and beyond?
That shift in timeframe changes everything. It changes how you measure success. It changes which risks matter and which don’t. It changes what you’re willing to pay for, what you’re willing to ignore, and whose advice you trust.
Over the past year, we’ve been asking ourselves the same question about our own practice.
We’ve spent three decades working with entrepreneurial families. First, as auditors, seeing how wealth is built and protected inside operating businesses, then as advisors helping families structure, preserve, and transfer that wealth. And we kept seeing the same pattern: brilliant business builders making financial decisions based on incomplete information or advice shaped by what was easiest to sell rather than what was best to recommend
So we made a choice. We restructured our practice around independence and long-term alignment with family interests. We deepened our focus on succession planning and multi-generational continuity because portfolios don’t matter if transitions are chaotic. And we changed our name to AuRREnt, reflecting what this work has always been about: enduring value and wealth that flows across generations, not just performance measured in quarters.
This isn’t about rejecting the past. It’s about aligning our structure with what we’ve always believed: that advice should be independent, intellectually honest, and designed for families building something meant to last.
Which brings us back to the question at the heart of this month’s letter: When you optimise for a good year, what do you sacrifice about the good decade?

Founder & Principal Advisor
AuRREnt Wealth
When families evaluate their wealth management, they typically look at:
These aren’t irrelevant. But they’re dangerously incomplete.
Let’s examine what these metrics actually tell you, and more importantly, what they hide.
When someone says, “My portfolio returned 14.2% last year,” it sounds authoritative. But that number conceals more than it reveals.
It tells you nothing about risk. A portfolio that returned 14% through five stable, high-quality businesses is fundamentally different from one that returned 14% through concentrated bets on penny stocks. One is repeatable. The other is luck that will eventually reverse.
The number is often calculated incorrectly, comparing year-end values without properly accounting for midyear deposits, withdrawals, and reinvested dividends. You might think you earned 15% when the actual return was closer to 11%.
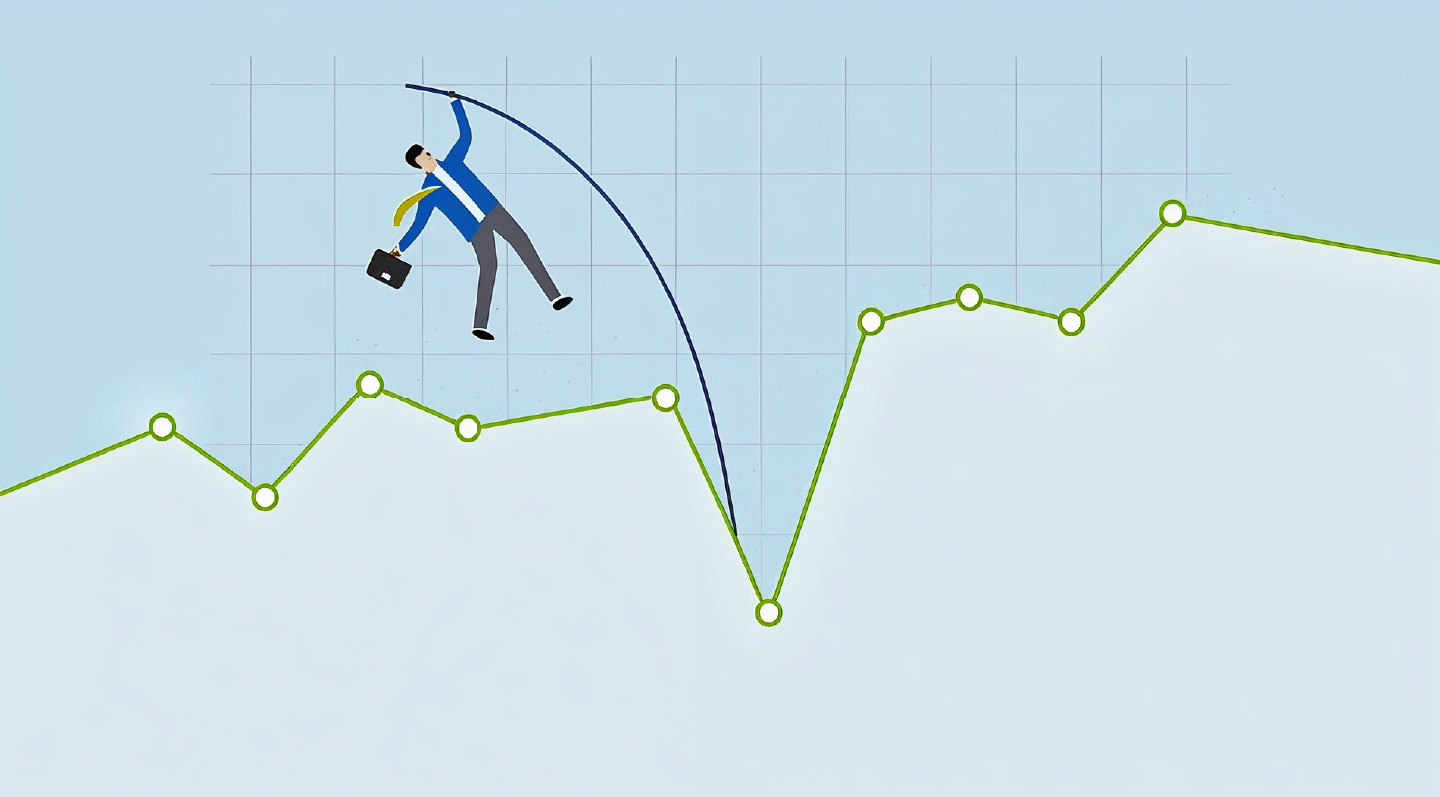
Most critically, it ignores the path taken. A portfolio that rose steadily by 1% per month is entirely different from one that crashed 30% in March, recovered dramatically, and ended at +14%. Both show similar annual numbers. But the second destroyed sleep, triggered panic decisions, and potentially forced liquidations during the downturn.
Consistency matters more than peak performance. A portfolio delivering 10% to 12% year after year, with manageable volatility, will compound to far more wealth (and far less stress) than one swinging between +25% and -15%.

“How did my fund rank against its benchmark?” seems reasonable until you realise the premise is flawed: your portfolio doesn’t exist to beat an index.
The Nifty 50 is useful as a market reference. But is it relevant to your actual goals? If you’re a business owner managing liquidity needs, business concentration risk, and building wealth for retirement twenty years out, why would success be defined by matching an index that has no concept of your tax situation, your sector exposures through your business, or your ability to tolerate volatility?
Benchmark obsession creates misaligned risk-taking. Fund managers compensated for beating the Nifty are incentivised to take tracking risk, even when holding cash during overvalued markets would better serve investors. This triggers the wealth-destroying behaviour of chasing recent performance and abandoning sound strategies during temporary underperformance.
We’ve seen families exit perfectly good long-term investments after 18 months of underperformance, only to watch those same strategies outperform dramatically after they’d left.
Over any given year, roughly 40% to 50% of active fund managers outperform their benchmark. Extend the timeframe to 10 years, and fewer than 20% consistently beat the market after fees. Over 20 years, the number approaches zero.
This isn’t because managers are incompetent. They’re operating in highly competitive markets where information spreads instantly, trading costs have collapsed, and fee structures mean they need to outperform by 1.5% to 2% annually just to match the index after costs.
So the question isn’t “can my manager beat the market?” It’s “do I need them to?” For most families, the answer is no. What you actually need is appropriate market exposure, diversification, tax efficiency, liquidity structure, and discipline to stay invested through volatility. None of that requires beating the market.
We use active management selectively where research edge matters. But we’ve stopped pretending that market-beating returns should be the primary goal. The goal is having enough wealth, managed appropriately, to accomplish what you’re trying to accomplish with your life.
Now, with that context, here are the metrics that actually determine whether wealth endures across generations. They rarely appear on the quarterly report, but they matter far more.
The question: Will your ownership structures hold up under stress?
Most families focus on what they own. Fewer think carefully about how they own it. And almost none stresstest whether those structures will survive family disagreement, regulatory change, or the cognitive decline of the person who set everything up.
We’ve seen estates with solid tax planning collapse because nobody documented why decisions were made. Trusts that worked perfectly on paper but created resentment among siblings because the intent was never explained. HUF structures that saved tax for decades but became sources of confusion when the next generation tried to understand them
Clear Documentation Clear documentation of ownership across all entities (personal holdings, HUF, trusts, company structures), explained in a way the next generation can actually understand, not buried in impenetrable legal documents.
Succession Protocols Succession protocols that don’t depend entirely on one person’s memory or goodwill, and governance frameworks designed to function even when family relationships are strained..
Periodic Reviews To ensure structures still serve their original purpose, since both families and regulations evolve.
A portfolio that generated strong returns but sits in a structure that will trigger family conflict hasn’t actually served its purpose. The best estate structures are the ones the next generation can understand, execute, and adapt without needing specialists to decode what was intended.

The question: Are you minimising taxes this year or across decades?
Tax efficiency sounds technical. It is. But the difference between optimising for this year’s return versus the next decade’s after-tax wealth is enormous.
Consider two mutual funds. Fund A delivers 14% returns, but high turnover triggers short-term capital gains annually. Fund B delivers 12% returns with a buy-and-hold approach that defers taxation. Over ten years, Fund B often wins after tax, despite lower headline performance.
Or take debt funds. Until April 2023, they offered indexation benefits that made them tax-efficient for longterm investors. Then the rules changed overnight. Families who’d built their fixed income allocation around this benefit suddenly faced a completely different tax outcome. Those who’d diversified their approach across multiple structures had flexibility. Those who’d concentrated in one strategy had to restructure at the worst time.
The families who build wealth over decades aren’t necessarily chasing the highest return each year. They’re often the ones who understand that taxes compound in reverse, and small inefficiencies become meaningful drags over time.

The question: Is your family prepared for the transitions ahead?
This is the metric almost nobody tracks until circumstances force the conversation.
In our three decades working with entrepreneurial families, we’ve noticed certain patterns. The founder has built something remarkable and accumulated substantial wealth. They’ve often done estate planning (wills, nominees, insurance). But the questions that determine whether transitions go smoothly often haven’t been addressed.
Often scattered across emails and notebooks, or simply known only to one person.
The answer is usually “my CA suggested it years ago” without a clear understanding of the original reasoning.
Rarely articulated, which means the next generation will be deciding without context.
We regularly work with second-generation family members trying to understand their parents’ financial architecture with incomplete information and limited documentation of intent. The technical estate planning might be perfectly sound, but if the family isn’t prepared for the human side of the transition, it’s still going to be difficult.
The most valuable inheritance isn’t necessarily maximum wealth. Often, it’s clarity about what was being built and why.
The question: How are the people advising you actually compensated?
This is uncomfortable to discuss, but it’s one of the most important determinants of the advice you’ll receive
over time
The traditional wealth management model in India has been product distribution dressed up as advice. An advisor recommends a mutual fund or insurance product and earns a commission from the manufacturer. The more you invest, the more they earn. The more frequently you transact, the more they earn.
This doesn’t make advisors dishonest. Most are trying to do right by their clients. But the structure itself creates conflicts that are hard to overcome through good intentions alone.
We’ve seen this play out predictably: insurance policies sold where commission was attractive rather than coverage needed, portfolio churn serving no investment purpose but generating transaction fees, complex structured products difficult to understand and expensive to exit, and recommendations coincidentally aligned with whatever the advisor’s firm was incentivised to push that quarter.
Transparency Being able to understand why something is being suggested, what alternatives were considered, and what trade-offs exist.
Independence Recommendations from research and suitability assessment, not from distribution relationships or promotional incentives.
Long-term thinking That values structure over transactions (sometimes the best advice is “hold what you have” or “a simple solution is fine here”).
Coordination Willingness to work with your existing advisors rather than competing for control.
We built our practice around a simple question: what would we want if it were our family’s wealth at stake? We recommend index funds when active management doesn’t add value. We tell families to hold existing investments when that’s the right decision. We design insurance solutions based on actual coverage needs and integrate them with estate planning.
This approach is more intellectually demanding than product distribution. It requires broader expertise across investments, taxation, estate planning, and family dynamics. But it creates the kind of advisor-client relationships that can last across market cycles and generational transitions.
The question: Can you access capital when life demands it, without undermining your long-term plan?
Portfolio returns are often measured as if life were static. But life isn’t. Businesses need capital injections. Health crises happen. Opportunities appear that require immediate funding. A portfolio that looks strong on paper but forces you to liquidate investments at terrible times has failed its primary purpose.
The challenge many families face: their wealth is concentrated in assets that are difficult to access quickly. Operating businesses, private equity commitments, real estate, and unlisted company shares. All are potentially valuable, but none are easily converted to cash when needed. Without proper liquidity planning, families end up borrowing at high rates rather than accessing their own capital efficiently, or making investment decisions driven by cash flow needs rather than sound strategy
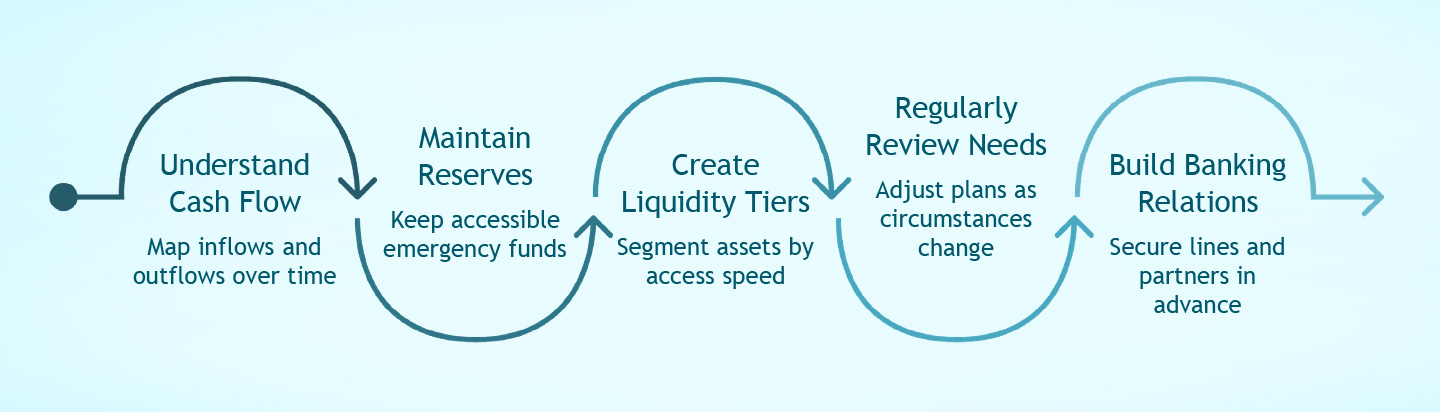
Understanding actual cash flow patterns (when money comes in and goes out from business operations, alongside personal expenses and potential large needs). Maintaining accessible reserves (most business families benefit from 12 to 18 months of expenses plus a business buffer in truly liquid, safe instruments). Creating clear liquidity tiers in the portfolio: what can be accessed easily, what requires some time, and what’s genuinely long-term capital. Reviewing liquidity needs as circumstances evolve. Building banking relationships in advance so credit is available before it’s needed.
The goal isn’t maximising returns on every rupee. It’s ensuring you’re never forced to make poor investment
decisions because you can’t access your own capital when circumstances demand it.

If you’re in your 20s or 30s and watching your portfolio decline 15% or 20% during market turmoil, everything in your body is screaming at you to do something. Sell before it gets worse. Move to safety. Stop the bleeding.
That instinct, whilst completely natural, is precisely what will prevent you from building lasting wealth.
When you’re 28, and your portfolio drops 20%, you haven’t lost money if you don’t sell. You’ve been handed a gift: the opportunity to buy quality assets at a discount for the next 30+ years of contributions.
If you were planning to buy a car next year and the dealership announced “all cars are 20% off for the next six months,” would you be upset? Your portfolio is the same. If you’re regularly investing (monthly SIPs, annual bonuses, systematic contributions), falling markets mean you’re acquiring more units at lower prices.
The mathematics are unambiguous: someone who invests £10,000 per year for 30 years through three major market crashes will end up with significantly more wealth than someone who tries to time the market and misses the recovery phases
Market turmoil exposes whether you actually understand your investments or were just following recent performance. If you bought a fund because it was “the best performer last year” without understanding its strategy, you’ll panic when it underperforms. But if you own it because you understand it invests in quality businesses with strong cash flows and proven management, then you know market declines don’t change the underlying thesis.
This is why we spend time helping younger family members understand portfolio construction, not just portfolio performance. When you know why you own something, you can distinguish between “this is broken, and I should exit” versus “this is working exactly as designed.”
Your first market crash is your most valuable teacher, but only if you learn the right lessons. The wrong lesson, “I should have sold at the peak and bought back at the bottom,” is a classic example of hindsight bias. Nobody knows where peaks or bottoms are in real time. Trying to time the market will cost you far more than you’ll ever gain from occasionally getting it right.
Maintain Liquidity Buffers
Having six to twelve months of expenses in savings means you never have to sell investments during a downturn. This single habit prevents most wealth-destroying mistakes, ensuring you can weather shortterm market turbulence without financial stress
Automate Your Investing
Systematic Investment Plans (SIPs) remove emotional decision-making. By investing the same amount regularly, regardless of market direction, you discipline yourself to buy more units when prices are low, benefiting from dollar-cost averaging over time.
Ignore the Noise
During market turmoil, financial media often sensationalizes events to generate anxiety and clicks. For a long-term investor, daily or weekly market movements are largely irrelevant. Focus on your long-term strategy, not the headlines.
Focus on What You Can Control
You cannot control market returns, but you can control your savings rate, asset allocation, costs, tax efficiency, and behavior during volatility. Empower yourself by directing energy toward these controllable factors.
Equity markets consistently deliver higher returns than fixed deposits over long periods. However, these returns are not smooth. The price you pay for potentially higher gains is volatility: periods where your portfolio value declines, sometimes significantly. If you genuinely have decades ahead of you, you can afford to tolerate this volatility because you have ample time to recover. Every major market decline in history has eventually recovered
The investors who built wealth through these challenging periods weren’t necessarily smarter or braver. They possessed the discipline to keep investing and had a structural setup (like adequate liquidity) that meant they were never forced to sell their investments during a downturn.
If this is your first serious market decline, you don’t have the emotional reference points to know what’s normal. Talk to your parents, or someone from their generation who’s invested through multiple cycles. They’ll tell you about 2008 when markets fell 50%, about 2000 when technology stocks crashed 80%, and about 2020 when COVID created the fastest 30% decline in history. And then they’ll tell you what happened next. Markets recovered. Companies adapted. Investors who stayed disciplined built wealth.
This context is invaluable. Not because history repeats exactly, but because it teaches you that volatility is normal, downturns are temporary, and discipline beats timing.
The next generation of every family we work with will face multiple market crises during their investing lifetime. That’s not pessimism. It’s statistics. What separates those who build wealth from those who don’t isn’t avoiding the downturns. It’s having the knowledge, discipline, and structural setup (liquidity, diversification, appropriate risk) to navigate them without making permanent mistakes.
If you’re young and watching your first market decline, you’re not behind. You’re exactly where you should be: learning the lessons that will serve you for the next 40 years of investing.
So if we’re not measuring success by annual returns and benchmark rankings, what does a good decade of wealth management actually look like?
Real Wealth Growth
Your wealth has grown in real terms (after inflation and taxes), not just in nominal account balances. Your family understands what you own, why you own it, and what to do with it. The next generation isn’t inheriting confusion.
Adaptability & Simplicity
You’ve adapted to major regulatory changes, significant market drawdowns, and personal life transitions without panic or forced liquidations. Your portfolio has become simpler to understand over time, not more complex. Complexity is expensive, fragile, and doesn’t survive generational transitions well.
Goal-Oriented Decisions
You’ve made decisions based on your goals and circumstances, not based on what products were being pushed or what everyone else was buying. Your structures (legal, tax, investment) still make sense and can be explained to a new advisor or family member without the original architect needing to decode them.
Proactive Conversations
You’ve had difficult conversations with family about wealth, succession, and responsibility, rather than leaving those for lawyers to have after you’re gone. And perhaps most importantly: you’ve spent less time worrying about your wealth and more time using it to enable the life and legacy you actually want.
Endurance
That’s not visible in a quarterly performance report. But it’s what endurance actually looks like.
We are in an era increasingly dominated by short-term thinking: the relentless focus on quarterly earnings reports, annual fund rankings, and the constant scrutiny of monthly portfolio statements. The financial industry often inadvertently encourages this mindset, designing systems that keep you fixated on immediate past performance and speculative future predictions for the next quarter.
But families who’ve built substantial wealth didn’t get there by optimising for the short term. They got there through discipline, long-term thinking, and willingness to make decisions that paid off over decades, not months.
Your wealth deserves the same approach.
This is precisely what AuRREnt is built to provide:
That’s what AuRREnt is built to provide. Advice grounded in research rather than product availability.
Structured for alignment rather than transactions. Oriented toward permanence rather than performance
theatre.
The name reflects what this work has always been about. Au for enduring value. Current for what matters now and what flows forward. Together: wealth that lasts because it’s built on structure, clarity, and genuine alignment of interests.
If you’d like to discuss how this applies to your family’s specific situation, we’re here for that conversation.

| Indices | 01-01-2026 | 31-01-2026 | High | Low |
|---|---|---|---|---|
| BSE S&P SENSEX | 85,255.55 | 82,269.78 | 85,883.50 | 81,088.59 |
| NIFTY 50 | 26,173.30 | 25,320.65 | 26,373.20 | 24,919.80 |
AUM Data of Mutual Fund
| Particulars | AUM As On 31-12-2025 | Fresh Fund Mobilized During Jan-26 | Redemption During Jan-26 | AUM As On 31-01-2026 |
|---|---|---|---|---|
| Total AUM of all mutual fund schemes | 79.19 | 13.85 | 12.28 | 80.76 |
| AUM of equity oriented (growth) schemes | 34.63 | 0.66 | 0.42 | 34.87 |
Source: Association of Mutual Fund of India (AMFI)
(INR. In Crore)
| Month | SIP Contribution (₹ Crore) | SIP AUM (₹ Crore) |
|---|---|---|
| Jan-2026 | 31,002 | 16,36,082 |
FII’s selling in the month is 0.42 Lakh.
DII’s buying in the month is 0.69 Lakh
| FII / DII | Gross Purchase | Gross Sale | Net |
|---|---|---|---|
| FII | 3.00 Lakh | 3.42 Lakh | (0.42 Lakh) |
| DII | 3.64 Lakh | 2.95 Lakh | 0.69 Lakh |
All statistics, contents, comparisons, conclusive discussions, other data, etc provided in this bulletin are based on facts and figures available in the public domain. We does not favour any particular product, fund, securities, stocks, investment mode, strategy or fund manager, etc. Comparison of any products, strategies, etc does not intent to favour any particular product, strategy, etc. Investment is a matter of independence and subjectivity. Investors are kindly requested to use their judgment, and decision or consult your financial advisor before making an investment decision.