
Home » India’s ₹40 Lakh Crore Discount
Dear Valued Client,
Markets, at their best, reward patience. At their worst, they test it. The past four weeks have been a test of the latter kind, and I want to begin this letter by acknowledging that directly. When you see sharp moves in your portfolio, it is natural to feel unsettled. That feeling is not a weakness; it is simply what it means to be a thoughtful investor in an uncertain world.
What gives me confidence in this environment is not optimism for its own sake. It is the data, the discipline of a long-term framework, and the strength of the domestic story that India has been quietly building for years. We have seen moments like this before. Each time, the investors who stayed the course were vindicated. I believe the same will be true here.
The analysis in this letter is our clearest thinking on where things stand and what the path forward looks like. I hope you find it useful and, above all, reassuring that there is a considered hand on the tiller.

Founder and Mentor
There are moments in markets that feel genuinely unprecedented, and the last four weeks have been one of them. The US-Israel-Iran conflict ignited on 28th February, and what followed was a rapid, global repricing of risk. The Strait of Hormuz, a 33-kilometre chokepoint through which over 20 million barrels of crude oil flow every day, became the most important piece of geography on earth for investors. Indian markets did not escape.
This letter is not about the war. It is about what the data tells us, what history says will happen next, and, most importantly, what it means for how your portfolio is positioned today. We will give you the facts as they stand, the historical context that most people are not looking at, and a clear framework for thinking through the months ahead. The instinct to act quickly in moments like this is understandable. We believe the data argues for a different approach.
The scale of the market reaction over the past four weeks is significant, but not without precedent. Here is where things stand as of this writing
| Index | Pre-War Level | Current Level | Change | Notes |
|---|---|---|---|---|
| Nifty 50 | 25,500 | 23,025 | -9.3% | 4-week drawdown from Feb 27 |
| Sensex | 81,800 | 74,347 | -9.1% | FII-driven selloff |
| Nifty Bank | 58,800 | 53,758 | -8.6% | HDFC and ICICI led decline |
| Nifty Auto | Base 100 | -11% | -11% | Crude input cost pressure |
| Nifty IT | Base 100 | -3.5% | -3.5% | Partial recovery on Accenture |
| Nifty Midcap | Base 100 | -9% | -9% | Broad-based correction |
| Nifty Smallcap | Base 100 | -8% | -8% | Selling across the board |
Sources: India Infoline Weekly Market Wrap, ICICI Direct, Business Standard, week ended 27 March 2026. Pre-war baseline: 27 February 2026.
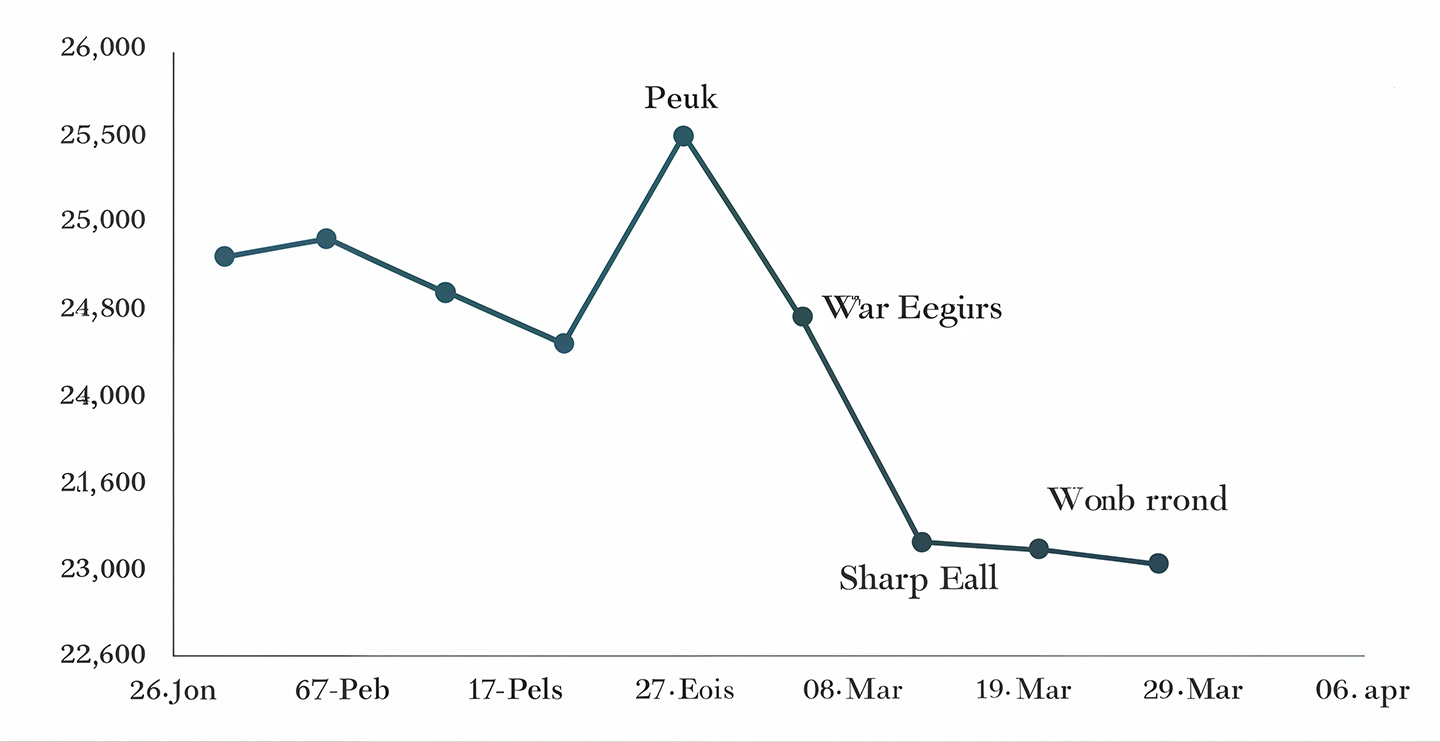
A few things stand out in these numbers. First, the damage has been uneven: Auto and Banking have borne the brunt, whilst IT has partially held up, supported by the rupee’s weakness boosting export revenue in INR terms. Second, Midcap and Smallcap have broadly tracked the index rather than amplifying it, which is itself a sign of a maturing market. Third, and perhaps most importantly, this correction has been orderly. The India VIX spiked to 26.32 at its peak on 23rd March, consistent with the 22 to 29 range seen during Russia-Ukraine shock in 2022. Elevated, but not the kind of reading that signals a disorderly or panic-driven market.
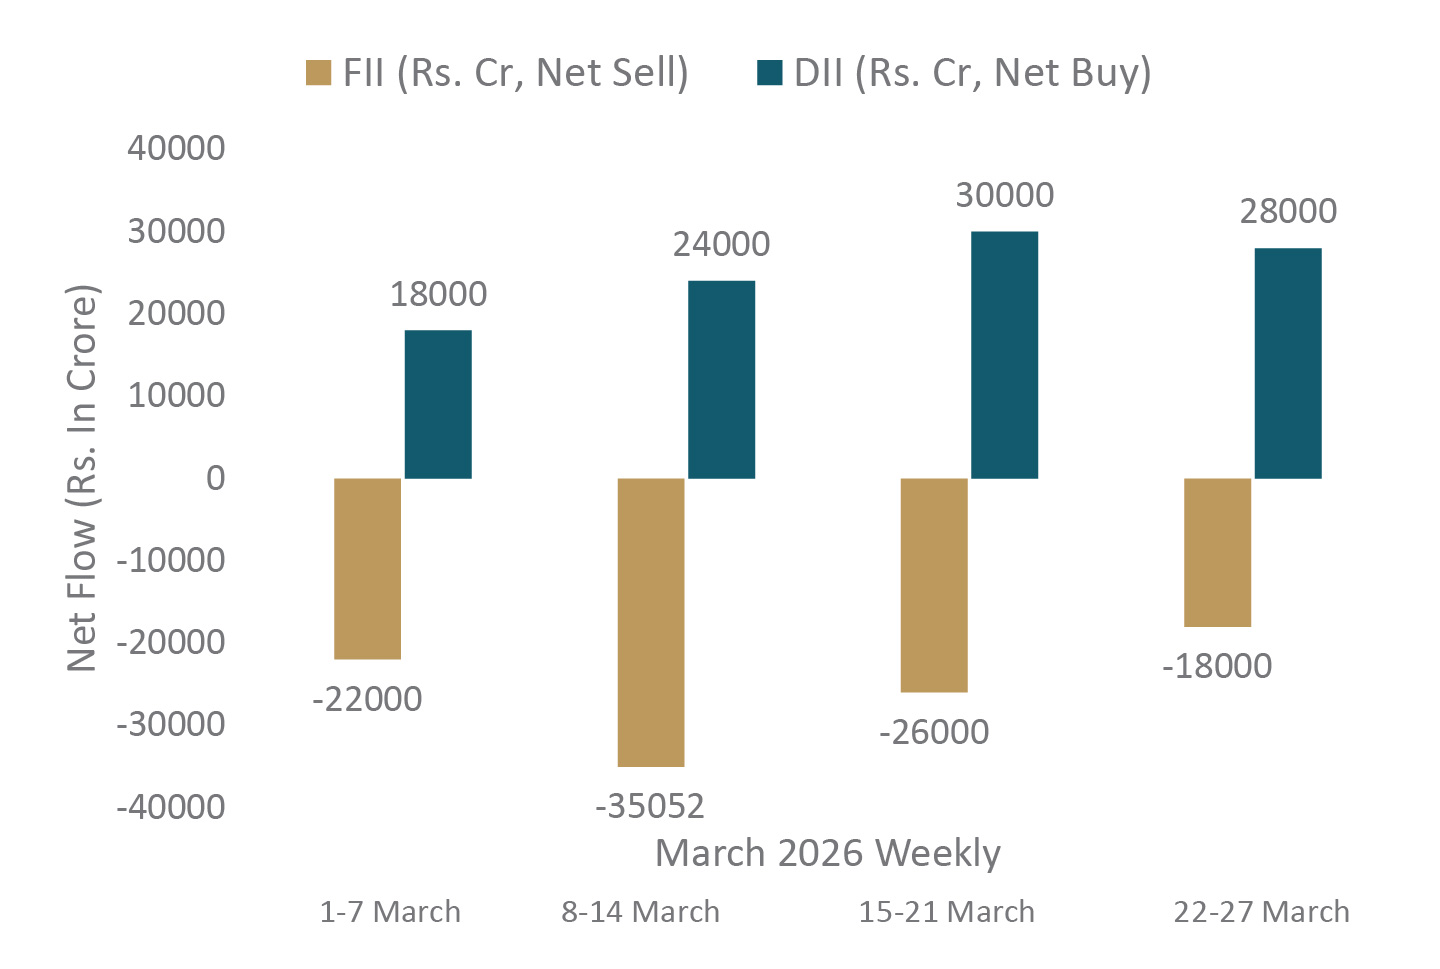
KEY DATA POINT: ₹1.01 lakh crore FPI net equity sales in March 2026 alone. To put this in perspective, FIIs sold ₹70,000 crore in the single worst month of the Russia-Ukraine selloff. This month has exceeded that. Yet the Nifty is down only 9%, not 16%. The market has absorbed this. That is a structural story worth sitting with.
The Indian story cannot be read in isolation. What is driving the selloff is a set of interlocking global pressures, each feeding the next. Understanding the mechanism matters for understanding when it might resolve.
| Asset / Index | 27 Feb 2026 | 27 Mar 2026 | Change | Direction |
|---|---|---|---|---|
| Brent Crude | $69/bbl | >$100/bbl | +50% | Up: supply shock |
| US 10Y Treasury Yield | 3.96% | 4.43% | +47 bps | Up: risk-off + inflation |
| India 10Y G-Sec Yield | 6.60% | 6.90% | +30 bps | Up: tracking US moves |
| USD/INR | 87.5 | 94.0 | +7.4% | Up: rupee under pressure |
| DXI (Dollar Index) | 104 | 99.5 | -4.3% | Down: safe-haven demand |
| S&P 500 | Base | 6-month low | -5% | Down: inflation fears |
| Nasdaq Composite | Base | Correction | -10%+ | Down: tech selloff |
| Gold (USD) | $2,800 ATH | Declining | -23% | Down: dollar and yield drag |
| MSCI Asia-Pacific ex Japan | Base | -1.2% | -1.2% | Down: broad EM weakness |
Sources: Upstox Market Analysis, Business Standard, Business Today, 27 March 2026.
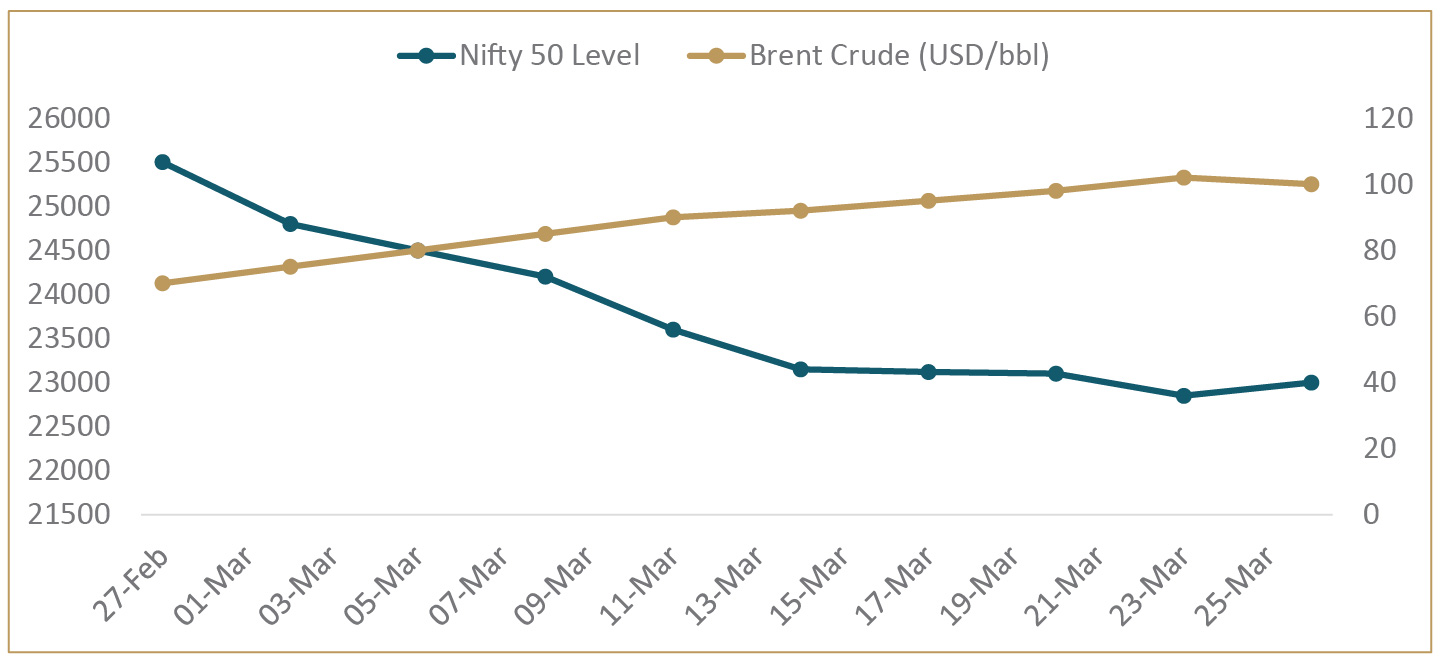
The crude oil move is the thread that ties everything together. A 50% surge in Brent over four weeks is not a routine fluctuation; it is a supply shock. The Strait of Hormuz, through which roughly 20% of all globally traded oil and LNG flows, has been severely disrupted. For India, which imports approximately 85 to 90% of its crude requirements, this is the most direct and immediate economic pressure point.
Both the US and Indian 10- year yields have moved meaningfully higher. Rising bond yields work against equities on two levels: they make fixed-income alternatives more attractive on a relative basis, and they raise the discount rate applied to future earnings. When FIIs sell Indian equities, part of the reason is simply that the US 10Y at 4.43% is now competing for that capital in a way it was not four months ago.
A weaker rupee at 94 to the dollar amplifies the problem for foreign investors. Even if Indian equity prices held steady in rupee terms, a dollar-based investor would be sitting on a currency loss. This creates a feedback loop: currency weakness begets FII selling, which weakens the currency further. The RBI appears to have been active in defending the 92 to 94 range through state-run bank interventions, providing some floor.
THE SILVER LINING: The rupee's weakness is a tailwind for India's IT sector and exporters. TCS, HCL Tech, and Tech Mahindra have shown relative resilience. Meanwhile, Indian G-Sec yields at 6.9% against inflation of just 2.1% produce a real yield of nearly 4.8% — one of the highest positive real yields India has offered in over a decade. For clients who have been holding excess cash or short-duration instruments, this is a genuinely compelling moment to extend duration in high-quality fixed income. The correction has handed fixed income investors a gift that does not come around often.
One of the most important developments in this selloff is often missed in the noise of daily headlines: Indian equity valuations have re-rated meaningfully lower. This matters because it changes the risk-reward equation for long-term investors.
| Metric | Pre-Correction (Jan 2026) | Current (Mar 2026) | 10-Year Historical Average |
|---|---|---|---|
| Nifty 50 PE (trailing) | 24 to 25x | 18 to 19x | 22.4x |
| Nifty 50 PE (forward) | 21x | 17 to 18x | 18 to 20x |
| Nifty Bank PE | Elevated | Corrected 15% | Below long-run avg |
| India VIX | 13 to 14 | 22 to 26 (peak) | 15 to 17 |
| Nifty vs 200-DMA | Above | Below / Near | Mean-reverting |
Sources: NSE Historical PE Data, Morgan Stanley India Equity Strategy, JM Financial Market Lens, Business Today, 24 to 27 March 2026.
According to NSE historical PE data, the Nifty’s 10-year average trailing PE sits at 22.4x. At approximately 18 to 19x today, the index is trading meaningfully below that long-run mean — a level last seen during the Covid recovery in 2020 and briefly after the Russia-Ukraine shock in 2022. Morgan Stanley’s India equity strategy note from March 2026 flags this same re-rating, observing that the risk premium embedded in Indian equities has risen to levels that have historically preceded strong forward returns over 12 to 18 months. This is not a screaming bargain; India has rarely been cheap on an absolute basis. But it is a materially different entry point than January’s elevated multiples, and the data argues that the correction has genuinely improved the odds for medium-term investors.
This is the part of the letter we think matters most. At moments of maximum uncertainty, the temptation is to act as though this time is different. The data from 25 years of Indian markets suggests otherwise.
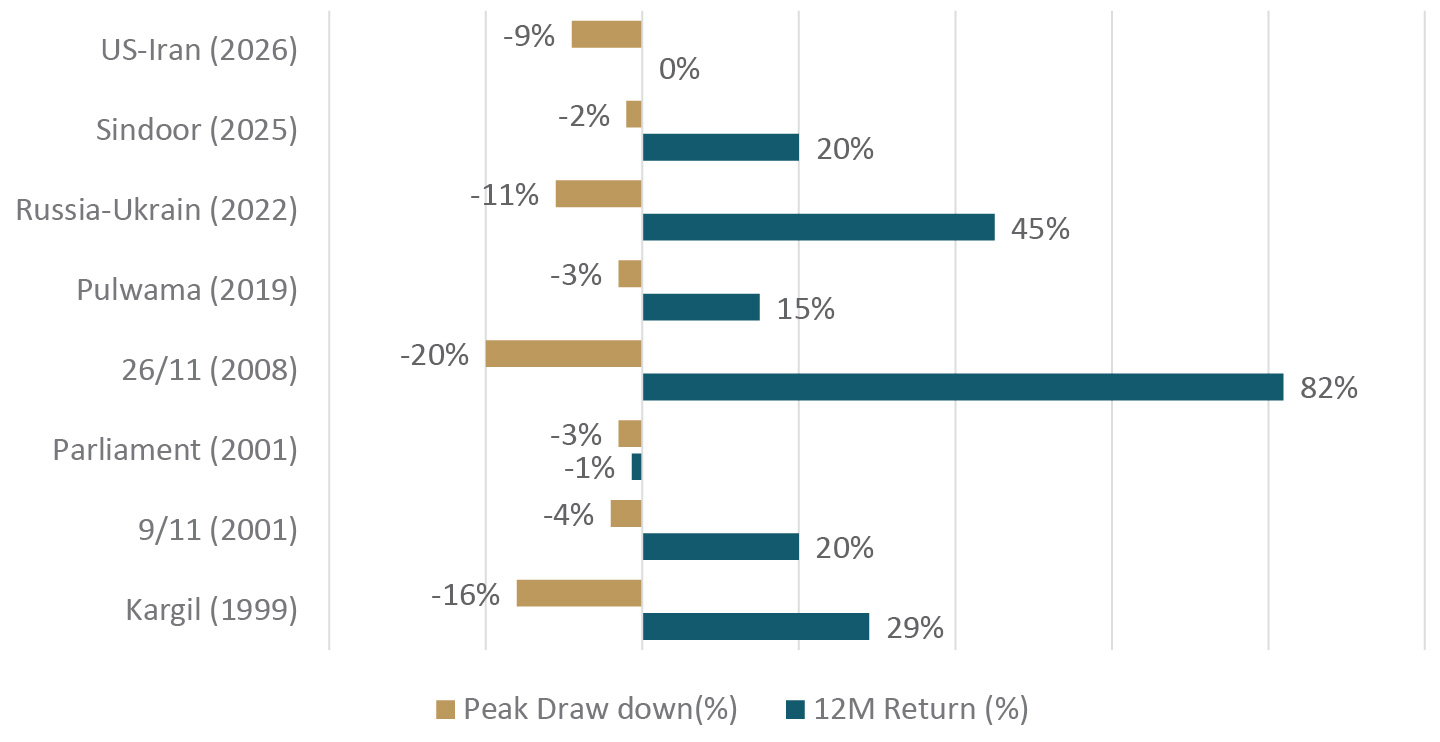
Three structural observations from this data deserve to be read carefully.
THE KEY HISTORICAL INSIGHT: In Anand Rathi Research's study of 11 major India-related geopolitical events since 1990, FPI flows remained positive or stable in 9 out of 10 episodes with available data. Global institutional investors treat these events as transitory shocks, not structural impairments. The current ₹1.11 lakh crore of March selling is violent, but history says it resolves.
Amid the noise, it is worth stepping back to assess what the conflict has and has not changed about India’s fundamental investment thesis.
| India Macro Variable | Status | Comment |
|---|---|---|
| GDP Growth (FY26 est.) | 6.5 to 6.6% | Fastest-growing major economy |
| CPI Inflation | 2.1% | Well below RBI’s 4% target |
| Repo Rate | 6.0% | Rate cut cycle largely complete |
| India 10Y G-Sec Yield | 6.9% | Real yield of ~4.8%; rare in India’s history |
| Current Account Deficit | Widening (crude risk) | Key near-term risk to monitor |
| Fiscal Deficit (FY26) | On track | Government capex continuing |
| SIP Monthly Inflow | Rs26,000 cr | Structural domestic support floor |
| DII Activity (March) | Net buyers >Rs1L cr | Absorbed much of FII selling |
| India-US Trade Deal | Tariffs cut to 18% | Long-term export tailwind intact |
Sources: RBI MPC, Ministry of Finance, Upstox, NSDL data, March 2026.
The single most important near-term variable is crude oil. If Brent stabilises below $90 and the Strait of Hormuz situation de-escalates, as Trump’s extended 6th April deadline now makes possible, the inflation narrative changes rapidly. India’s inflation at 2.1% gives the RBI significant room. A sustained oil price above $110 for three or more months would begin to meaningfully impact the current account deficit and complicate that picture.
Everything else, including growth, earnings trajectory, domestic consumption, and the manufacturing and export story, is structurally intact. The geopolitical premium being applied to Indian equities right now is a function of uncertainty, not of any change in India's fundamental economic position.
| Sector | Current Position | Conflict Impact | Recovery Thesis |
|---|---|---|---|
| IT / Technology | IT Index down 3.5%; held up relatively well | Neutral to positive (rupee tailwind) | Strong: Accenture numbers signal stable demand |
| Pharma | Defensive; stable | Neutral: global demand inelastic | Strong: freight cost rise manageable |
| Defence and PSU | Relative outperformer | Structural tailwind | Multi-year visibility; HAL, BEL, Mazagon best placed |
| Energy (upstream) | PSU ONGC resilient | Positive: higher realisation | Positive at elevated crude prices |
| Financials / Banks | Down 8 to 10% | FII-led selling; most liquid names | Strong recovery: Russia-Ukraine showed +30% in 3 months |
| Auto | Down 11% | Input cost pressure | Historically leads recovery; watch closely |
| Metals | Under pressure | Input cost uncertainty | Led post-Russia-Ukraine recovery (+35% in 3 months) |
| Aviation | Significant pressure | ATF prices surge; IndiGo down 5%+ | Laggard until crude normalises |
| Oil and Gas (refining) | Under pressure | GRM compression | Wait: Singapore GRMs remain volatile |
| Real Estate | Down 15% | Rate and sentiment driven | Recovery likely post crude stabilisation |
Sources: ICICI Direct Geopolitical Impact Report, Republic World, India Infoline sector wraps, March 2026.
Two sectors deserve special mention. The first is defence. India announced an emergency Rs80,000 crore procurement in March 2026. This is not a headline; it is a budget commitment. HAL, BEL, Mazagon Dock, and the broader domestic defence ecosystem now have multi-year earnings visibility that did not exist eighteen months ago. A note of caution: HDFC Securities has flagged that BDL is currently trading at approximately 85x earnings, and several defence names are priced for perfection. Individual stock selection matters more than a blanket ‘buy defence’ call.
The second is the financial sector. Banks have been disproportionately sold because they are the most liquid, most FII-owned segment of the market. That is precisely why they tend to lead recoveries. Credit growth is a domestic story; it does not change because of a conflict in the Strait of Hormuz. As FII selling abates, the rerating in quality private sector banks is likely to be one of the sharper moves on the upside.
We do not make the mistake of predicting the duration or outcome of the US-Iran conflict. What we can do is build a framework that helps you think clearly regardless of how it unfolds.
| Scenario | Market Implied Probability | Crude Trajectory | Nifty Implication |
|---|---|---|---|
| De-escalation / Diplomacy | Rising (Apr 6 deadline signals intent) | Back toward $75 to $85 | Sharp recovery: 15 to 20% upside from trough |
| Prolonged Stalemate | Moderate | Range-bound $95 to $110 | Consolidation: earnings season is the swing factor |
| Material Escalation | Lower but nonzero | $120+: Hormuz closure risk | Further drawdown; defensive positioning critical |
Scenario Market Implied Probability Crude Trajectory Nifty Implication De-escalation / Diplomacy Rising (Apr 6 deadline signals intent) Back toward $75 to $85 Sharp recovery: 15 to 20% upside from trough Prolonged stalemate Moderate Range-bound $95 to $110 Consolidation: earnings season is the swing factor Material escalation Lower but nonzero $120+: Hormuz closure risk Further drawdown: defensive positioning criticalThe market’s current positioning, with Nifty at 18 to 19x earnings, VIX elevated but not spiking further, and DIIs actively absorbing supply, suggests that the base case is already partly in the price. ICICI Direct’s analysis states explicitly that the bulk of the decline appears largely behind the market.
The practical implication of the historical pattern is this: geopolitical corrections average approximately four weeks in duration. We are at the four-week mark. That does not mean the bottom is confirmed, but it does mean that the period of maximum headline risk and maximum forced selling is typically behind us at this stage.
Panic is not a strategy. But neither is false confidence. The data tells us that this correction has been orderly, that valuations have re-rated meaningfully, that domestic buyers have absorbed a historically large volume of FII selling, and that every comparable episode in 25 years of Indian market history has ultimately resolved in the market’s favour. We are not calling an all-clear; crude and geopolitics can surprise. We are saying that the framework for patient, quality-focused investors remains intact.
Four weeks ago, the world changed shape, quickly and without warning. Indian markets reacted exactly as they should in a global energy supply shock: they fell, volatility spiked, and foreign capital retreated to safety. None of that is surprising. What is perhaps surprising, and what deserves to be the headline of this letter, is how much the market has held up in the face of it all.
Rs1.11 lakh crore of FII selling in a single month is an extraordinary number. The Nifty being down just 9% in response is not a sign of complacency; it is a sign of structural maturity. Domestic capital, SIP inflows, and DII buying have together absorbed a historic volume of foreign selling. The market has shown its hand, and its hand is stronger than it has ever been.
Here is what the data is telling us plainly: quality Indian equities are currently available at a 15 to 20% discount to where they were six weeks ago. The Nifty is trading below its 10-year average PE. Bank stocks, which are fundamentally a domestic credit story with no direct exposure to the Strait of Hormuz, are down 8 to 10% purely because they are the most liquid instruments for foreign sellers. Auto, which historically leads every post-shock recovery, is down 11%. These are not distressed valuations driven by earnings deterioration. They are sentiment-driven discounts on businesses whose underlying fundamentals have not changed.
Every episode in the historical data we have shared in this letter — Kargil, 9/11, Mumbai 26/11, RussiaUkraine, and every comparable shock in between — resolved in favour of the patient investor. Not because markets always go up in the short run, but because India’s growth story is not a function of any single geopolitical event. At 6.5% GDP growth, 2.1% inflation, and a domestic consumption engine that is entirely independent of what happens in the Strait of Hormuz, the fundamental case for Indian equities is, if anything, more compelling today than it was at January’s peak multiples.
This is not the moment to reduce. The correction has been orderly, valuations have re-rated meaningfully, and domestic buyers have absorbed a historically large volume of FII selling.
The data suggests you are looking at one now. Quality Indian equities are available at a 15 to 20% discount to where they were six weeks ago.
The case for closing that gap has rarely been as clearly supported by the numbers as it is today.
We are available to discuss how this translates specifically to your portfolio, whether that means reviewing your current allocation, identifying the sectors best placed for the recovery, or simply talking through what this environment means for your financial plan. Do reach out to your relationship manager, and we will make the time.
Stay invested. The data is on your side.
This letter is prepared for informational purposes and does not constitute investment advice. All data points are sourced from publicly available market reports and research as of 27 to 28 March 2026. Past performance is not indicative of future results. Please consult with your relationship manager before making any portfolio changes.
| Indices | 01-03-2026 | 31-03-2026 | High | Low |
|---|---|---|---|---|
| BSE S&P SENSEX | 78,543.73 | 71,947.55 | 80,632.55 | 71,774.13 |
| NIFTY 50 | 24,659.25 | 22,331.40 | 24,989.35 | 22,283.85 |
| Particulars | AUM As On 31-01-2026 | Fresh Fund Mobilized During Feb-26 | Redemption During Feb-26 | AUM As On 28-02-2026 |
|---|---|---|---|---|
| Total AUM of all mutual fund schemes | 80.83 | 13.55 | 12.60 | 81.78 |
| AUM of equity oriented (growth) schemes | 35.13 | 0.62 | 0.36 | 35.39 |
(INR. In Lakh Crore)
Source: Association of Mutual Fund of India (AMFI)
| Month | SIP Contribution (₹ Crore) | SIP AUM (₹ Crore) |
|---|---|---|
| Feb-2026 | 29,845 | 16,64,085 |
| FII / DII | Gross Purchase | Gross Sale | Net |
|---|---|---|---|
| FII | 2.79 Lakh | 4.01 Lakh | Selling : 1.23 Lakh |
| DII | 4.15 Lakh | 2.72 Lakh | Buying : 1.43 Lakh |
(INR. In Lakh Crore)