
Home » Why India’s Best Earnings in a Decade Left the Index Unmoved
Dear Reader,
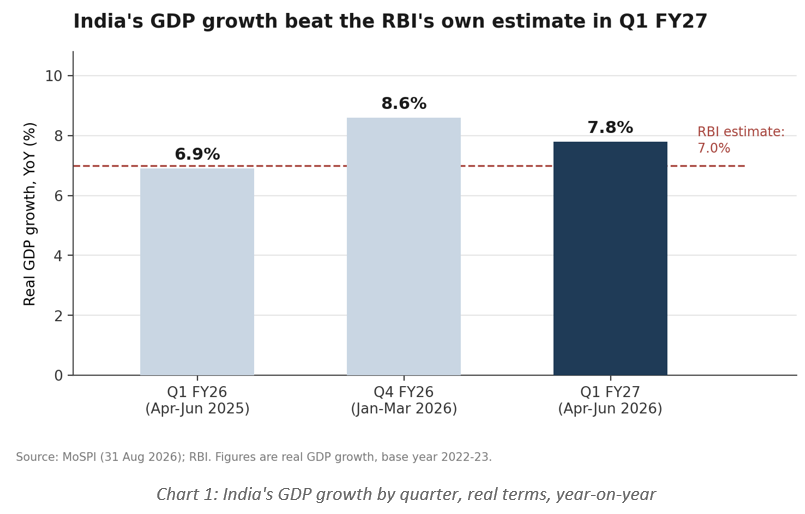
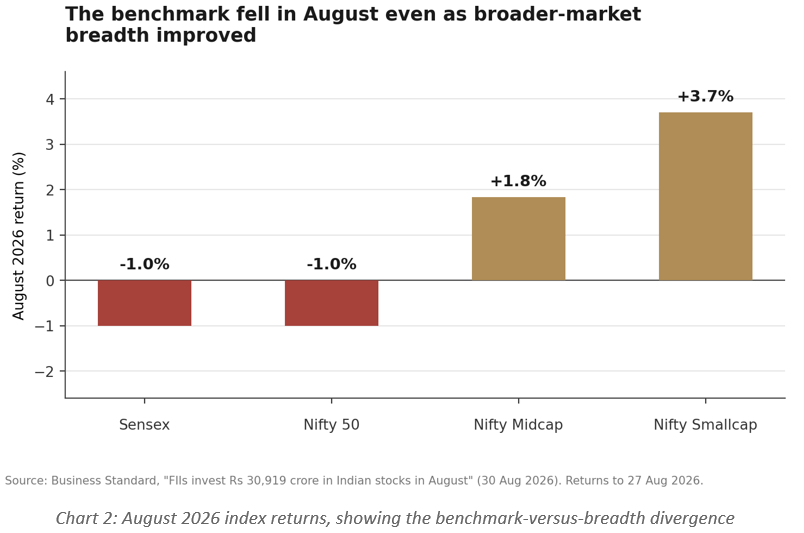
In the June quarter, Nifty 50 companies grew profits 18 per cent year-on-year, the fastest pace in ten quarters. In the same window, India’s GDP grew 7.8 per cent, comfortably ahead of the Reserve Bank of India’s own 7 per cent estimate. By most measures, this ought to have been a good few months for Indian equities. Instead, the Sensex and Nifty are down roughly 8 to 10 per cent for the year to end-August, and the Nifty itself fell about 1 per cent in August despite the strongest month of foreign buying since September 2024. Something does not add up, and the gap between what the headline numbers say and what the index has done is, in our view, the most useful thing an investor can understand about India right now.
Chairman and Founder
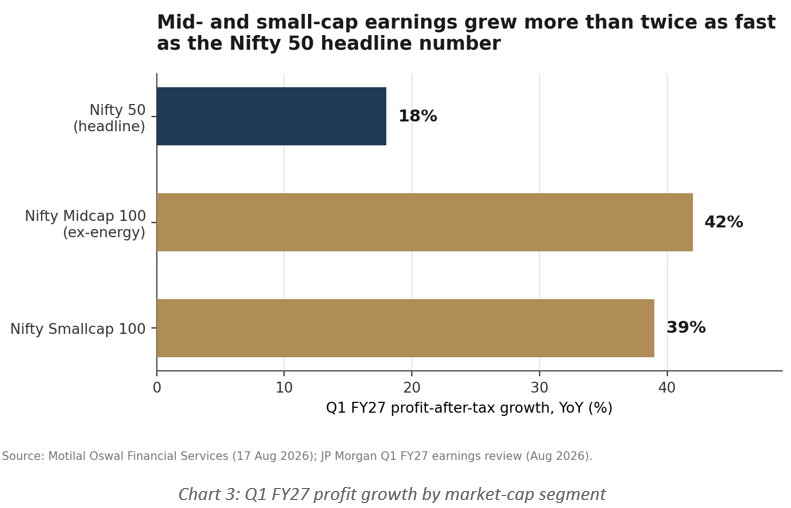
The instinct when growth and earnings beat expectations but the index does not move is to conclude that the market is “wrong,” or cheap, or about to catch up. We think that instinct misreads what is happening. The 18 per cent Nifty earnings growth was real, but it was also narrow: five companies, ONGC, Hindalco, Reliance Industries, JSW Steel and Bharti Airtel, accounted for 60 per cent of the incremental profit growth, according to Motilal Oswal’s analysis of the quarter, and much of that came from metals pricing (Hindalco’s profit rose 118 per cent, JSW Steel’s 96 per cent, Vedanta’s 152 per cent) rather than from broad-based volume or margin expansion. Strip that concentration away and a different picture appears: the Nifty Midcap 100 (excluding energy) grew profits 42 per cent year-on-year and the Nifty Smallcap 100 grew 39 per cent, according to JP Morgan’s review of the quarter, roughly double to triple the large-cap pace.
This matters because India’s benchmark indices are large-cap, concentration-heavy instruments. When the earnings engine of the moment is a handful of commodity and energy names whose profits move with global metal and crude prices rather than with domestic demand, the benchmark can look flat even while large parts of corporate India are compounding earnings quickly. Foreign investors appear to have understood this before the benchmark did: August’s Rs 30,919 crore of net equity buying, the strongest month since September 2024, went disproportionately into financials, autos, consumer services and healthcare, sectors with steadier, more domestically driven earnings, while capex-linked segments such as capital goods, power, telecom and real estate saw net selling.
FPIs bought a net Rs 30,919 crore (approximately $3.25 billion) of Indian equities in August, the strongest month in nearly two years, following Rs 20,200 crore in July, according to NSDL-sourced data reported by Business Standard, BusinessToday and the Free Press Journal (30-31 August 2026). Even so, FPIs remain net sellers of roughly Rs 2.23 trillion (approximately $23.4 billion) for calendar 2026 to date, so the recent buying is a partial reversal, not a wholesale change of view. What stands out is where the money went.
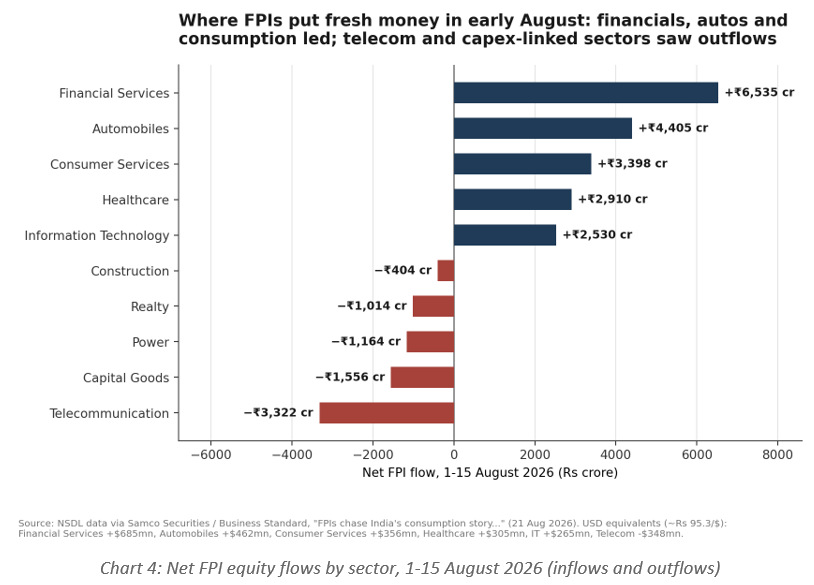
Financial services drew the largest single allocation in the first half of August, reversing a July outflow, followed by autos and consumer services; IT drew further buying as part of a tactical reversal after a near-30 per cent first-half correction in the Nifty IT index. On the other side of the ledger, telecom (the single largest outflow at Rs 3,322 crore), capital goods, power, realty and construction, the sectors most associated with India’s capex narrative, saw net selling. Domestic mutual funds, running on steady SIP inflows, have been the more consistent buyer through 2026 and appear to be absorbing a meaningful share of the supply that FPIs create when they rotate rather than simply add.
The debt side of the ledger tells a complementary story: FPI flows into government securities under the Fully Accessible Route collapsed from Rs 21,652 crore in June to just Rs 264 crore in August, and FPIs sold a further Rs 2,224 crore of general-limit debt securities during the month, according to 5paisa’s review of NSDL and CCIL data. Foreign investors are, for now, more interested in India’s growth story than in its bonds, which is consistent with a world where US Treasury yields remain elevated and the relative appeal of Indian debt has narrowed.
What is changing: after two months of outflows, FPIs returned as the largest single buyer, with allocation steady near 31 to 32 per cent of total FPI equity AUM. Why: the sector offers earnings visibility investors can underwrite without depending on commodity prices, at a time when the RBI has held rates steady. What it means for earnings: banks benefit from a stable rate environment and continuing credit growth, though margin trajectories bear watching. What could be mispriced: the market may be under-distinguishing between well-capitalised, well-provisioned lenders and those more exposed to unsecured or MSME stress. Key risk: any inflation surprise that forces the RBI off its neutral stance sooner than expected.
What is changing: the sector went from a bottom-ten earnings contributor a year ago to the second-largest this quarter, driven by pricing rather than volumes. Why: global metal prices firmed alongside broader commodity strength tied to the same geopolitical backdrop pushing up oil. What it means for earnings: very high sensitivity to prices set outside India; this quarter’s growth rates are unlikely to repeat mechanically. What could be mispriced: investors extrapolating this quarter’s growth rate as a new earnings trajectory rather than a cyclical price effect. Key risk: a reversal in global metal prices would remove a large share of this quarter’s headline Nifty growth.
What is changing: the Nifty IT index fell close to 30 per cent in the first half of 2026 on fears that generative AI would cannibalise services billing, then rallied 16.7 per cent in July as FPIs returned, reframing Indian IT majors as the execution partners needed to modernise enterprise systems and deploy AI at scale, rather than as AI’s casualties. What it means for earnings: revenue growth remains modest, but the narrative premium, or discount, attached to the sector has swung sharply in a matter of weeks. What could be mispriced: both the original panic and the subsequent relief rally may be ahead of the actual pace at which AI reshapes services demand, in either direction. Key risk: this is now consensus enough as a “value and mean-reversion trade” that it may already be reflected in prices.
What is changing: despite a well-documented multi-year capex and infrastructure narrative, FPIs were net sellers of capital goods, power, telecom and real estate through August. Why: these are capital-intensive, longer-duration businesses that look less attractive when global risk-free rates are elevated, and selling here should not be read as investors abandoning the capex theme outright; brokerages such as JP Morgan remain selectively constructive on names tied to power demand and data-centre-driven electricity growth (Hitachi Energy, ABB India, NTPC were specifically flagged). What could be mispriced: broad-brush selling may be creating dislocations between the capex cycle’s genuine structural winners and merely capex-adjacent stocks caught in the same outflow.
The US-Israel military campaign against Iran, under way since late February 2026, has kept the Strait of Hormuz, the transit route for roughly a quarter of the world’s seaborne crude and a fifth of its LNG, running at a small fraction of pre-conflict traffic, with Brent trading near $87 to $90 a barrel through August.
Eelevated and volatile crude has kept US inflation uncomfortably above target, prompting the Federal Reserve to hold rates at 3.50 to 3.75 per cent through its fifth consecutive meeting in July, with markets assigning roughly a one-in-three chance of a hike rather than a cut. Higher-for-longer US rates keep the “risk-free rate” that foreign investors measure emerging-market equities against elevated, a headwind ICICI Securities has explicitly flagged for FPI flows into India.
India, which imports roughly 85 per cent of its crude needs, has leaned further into discounted Russian barrels to manage the bill; Russia’s share of India’s oil import value hit a record 48.6 per cent in June 2026, even as the Russian discount itself narrowed from about $77.7 a tonne in April to $10.6 a tonne in June, eroding some of the benefit. The rupee has weakened past Rs 95 to the dollar at times in 2026 before recovering to around Rs 94.4 to 95.6 in early September.
Oil marketing companies remain a drag on Nifty earnings despite the metals-led recovery elsewhere; refiners and downstream users of imported inputs face margin pressure from currency and crude volatility together.
This is not simply a story about the price of oil. It is a reminder that India’s February 2026 tariff relief from the US, which cut the effective rate from 50 per cent to 18 per cent, was explicitly conditioned on India halting Russian oil purchases, a commitment Indian refiners have not fully honoured as discounts widened again in August. A bipartisan US Senate bill passed in August could expose India to tariffs of up to 100 per cent on Russian energy purchases. This is a quiet, underpriced risk sitting beneath a calm tariff headline, and it links crude markets, currency policy and India’s largest single trade relationship in one chain.
For long-term investors, the practical lesson this month is not a call on the market’s direction but a caution about what the headline index is, and is not, telling you. A portfolio built with reference only to the Nifty or Sensex level risks missing both the genuine broadening of earnings happening in the mid- and small-cap space and the concentration risk sitting inside the benchmark itself, where a handful of commodity-sensitive names can move the index without reflecting the health of the wider economy. This may warrant a closer look at diversification across market capitalisation rather than treating “Indian equities” as a single, homogenous exposure captured by one index number.
The implication for diversified portfolios is twofold. First, the case for active, bottom-up allocation, whether through direct equity, multi-cap mandates or selective mid- and small-cap exposure, strengthens when index-level returns disguise wide dispersion beneath the surface, as they appear to now. Second, the quiet trade-policy risk around Russian oil purchases is a reminder that India’s external environment remains more contingent than the calm surface of 18 per cent tariffs suggests; investors with meaningful exposure to export-oriented sectors, or with global diversification already in place, are better positioned to absorb a surprise here than those concentrated purely in domestic, India-only large-cap exposure. For family offices and multi-generational portfolios in particular, this is less a moment for tactical repositioning than for confirming that existing allocations are not unintentionally concentrated in the same handful of names currently doing the heavy lifting for the benchmark.
The prevailing narrative treats India’s 18 per cent earnings growth and 7.8 per cent GDP print as confirmation that the domestic growth story is firing on all cylinders, and treats the flat benchmark as a temporary mispricing that should soon correct upward. We think this both overestimates the durability of the current earnings mix and underestimates two quieter risks. It overestimates durability because a large share of this quarter’s Nifty earnings growth came from metals pricing, a cyclical, globally set input that is not obviously repeatable, rather than from broad-based domestic demand. It underestimates risk on two counts: the genuine deceleration in manufacturing PMI momentum sitting alongside the GDP beat, and the unresolved tension between India’s Russian crude purchases and the trade-tariff truce with the US, which the market is currently pricing as settled. For the bullish, “the index will catch up to earnings” view to work cleanly, both of these need to resolve favourably: earnings growth needs to broaden beyond five names, and the tariff relationship needs to hold despite continued Russian oil buying. Neither is guaranteed.
There is a simple test worth applying to any strong headline number over the next few quarters, and it is more useful than debating whether the number itself is good or bad. Ask what would have to remain true for it to repeat. An 18 per cent earnings print holds up only if metals prices, a variable set in Shanghai and London rather than in Mumbai, stay roughly where they are. An 18 per cent tariff rate holds up only if a trade concession on Russian oil that has already been quietly set aside does not come up for renegotiation in Washington. A 7.8 per cent GDP print holds up as a signal of broad-based strength only if services continue to carry a manufacturing sector that is visibly losing pace. Applied this way, the test is not a forecast, and it is not a reason for caution over conviction. It is simply a discipline: the investors who do best from here are unlikely to be the ones who read this month’s numbers most optimistically or most sceptically, but the ones who kept asking, quarter after quarter, which parts of the story were load-bearing and which were passengers.
01stAug 2026 | 31stAug 2026 | HIGH | LOW | |
BSE S&P SENSEX | 78883.34 | 76957.27 | 79143.15 | 76751.32 |
NIFTY 50 | 24572.70 | 24080.40 | 24774.30 | 23993.60 |
(INR. In Lakh Crore)
Particulars | AUM As On 30-06-2026 | Fresh Fund Mobilize During July–2026 | Redemption During July–2026 | AUM As On 31-07 -2026 |
Total AUM of all mutual funds scheme | 83.22 | 15.98 | 13.61 | 85.59 |
AUM of equity oriented (growth) schemes | 38.11 | 0.70 | 0.45 | 38.36 |
Source: Association of Mutual Fund of India (AMFI)
(INR. In Lakh Crore)
Month | SIP Contribution | SIP AUM July-2026 |
July–2026 | 31,961 | 18,19,542 |
(INR. In Lakh Crore)
For The Month OfAug-2026 | Gross Purchase | Gross Sale | Net |
FII | 3.39 Lakh | 3.46 Lakh | (0.08 Lakh) Selling |
DII | 3.56 Lakh | 2.98 Lakh | 0.58 Lakh Buying |
Disclaimer
This newsletter is prepared for informational and educational purposes only and does not constitute investment, legal or tax advice, nor a recommendation to buy, sell or hold any security or asset class. It does not take into account the individual financial circumstances, objectives or risk tolerance of any reader. Past performance is not indicative of future results. Readers should consult their own advisers before making investment decisions.