
Home » How to Build a Sleep-Well-at-Night Portfolio in Volatile Times
Dear Valued Client,
The first quarter of 2026 has tested the composure of even the most seasoned investors. The confluence of geopolitical shocks, a weakening rupee, and a sharp correction in domestic equities has generated anxiety across portfolios that were, in many cases, delivering strong returns just six months ago. I understand this intimately, because I am navigating the same environment alongside you.
In thirty years of managing private wealth through Black Swan events, currency crises, global financial meltdowns, and pandemic shocks, I have arrived at one enduring conviction: the clients who protect generational wealth are not those who predict the market. They are those who build portfolios that do not require them to.
This note is not about short-term market calls. It is about helping you reframe your portfolio architecture for a structural regime change that I believe is now firmly underway. The era of suppressed volatility and nearzero rates that rewarded passive, concentrated equity strategies is behind us. What lies ahead demands a more sophisticated, multi-asset, and globally diversified approach.
The good news is this: the data, which our investment committee has reviewed exhaustively, points to some extraordinary opportunities buried within this turbulence. Indian equities are at valuations not seen since 2020. The bond market is offering yields that make a compelling case for a return to fixed income. And global diversification, particularly intoselect Asian markets that have been overlooked in the rush to judge all emerging markets by the same yardstick, offers a genuine edge.
I ask you to read this note carefully, share it with your family office advisors, and then call your relationship manager at Capital Compass to schedule your portfolio architecture review. The time to build is now, not when the uncertainty has cleared and the prices have moved.

Yours in confidence,
Founder, AuRRent Wealth
The conversations in our offices over the past six weeks have had a common thread. Sophisticated investors with well-constructed portfolios are losing sleep. Not because they are uninformed, but because the signals they have relied upon for a decade have stopped working in a predictable manner.
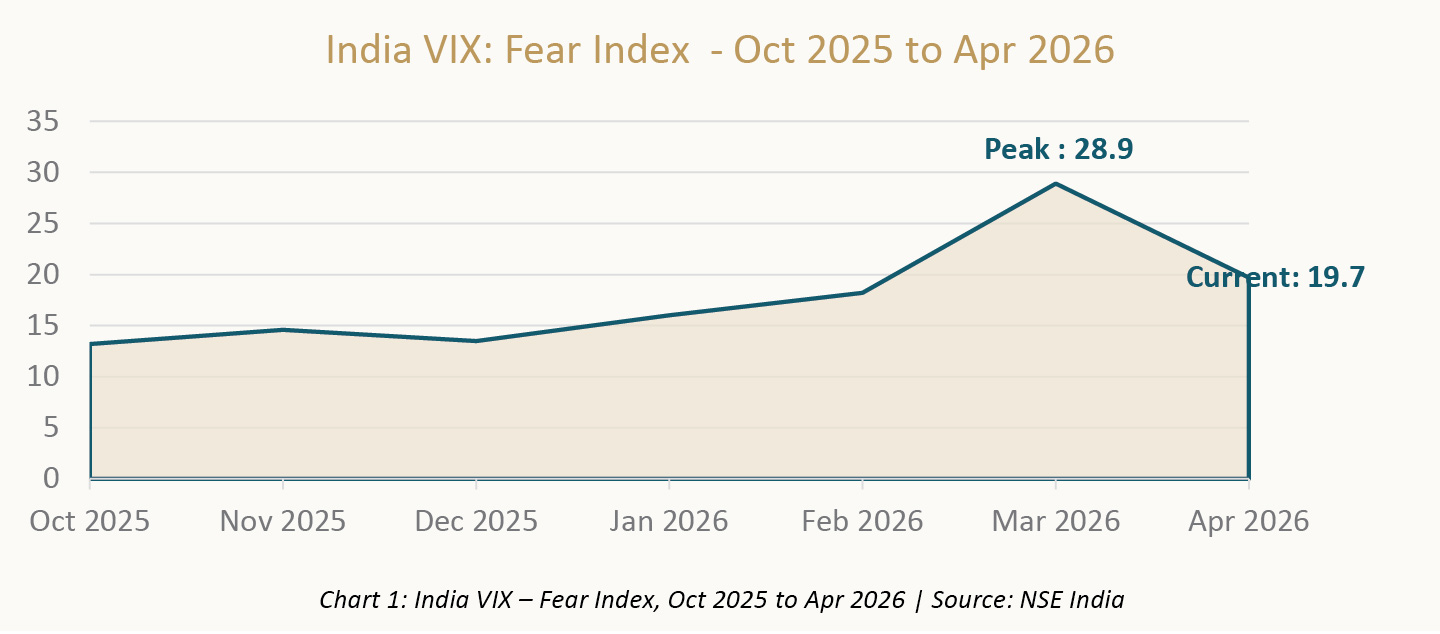
The India VIX, our market’s principal barometer of fear and uncertainty, told the story bluntly. It more than doubled in recent weeks, hitting an intraday high of 28.90, before settling near 19.71 as of the time of writing. To contextualise this: a VIX reading above 20 has historically corresponded to periods of significant institutional repositioning, not retail panic. This is not noise. This is a structural signal.
The proximate cause is a confluence of geopolitical shocks. The ongoing Middle East conflict has driven Brent crude above $110 per barrel, which carries a direct consequence for India. As a nation that imports roughly 85% of its oil requirements, every dollar above $90 is a quiet tax on the current account, on corporate margins, and ultimately on equity valuations. The ripple effect of that one data point touches inflation, the Reserve Bank of India’s rate trajectory, and the fiscal arithmetic simultaneously
The volatility you are experiencing is not a temporary aberration that will self-correct. It is structural. The era of synchronised global central bank accommodation that acted as a suppressor of volatility between 2010 and 2021 is behind us.
What is needed is not a trading strategy. What is needed is a portfolio architecture designed for the world as it is, not as it was.
KEY SIGNAL:India VIX surged to a high of 28.90 and remains elevated near 19.71. Brent crude above $110. Nifty down ~12% in March 2026. This is not a dip to buy impulsively. This is a regime change that demands a structural response.
For decades, the dominant investment framework for sophisticated investors was the 60/40 portfolio: 60% equities, 40% bonds. The logic was elegant. Bonds provided income and acted as a counterweight when equities fell. The model worked exceptionally well in a world of declining interest rates and low inflation.
That world no longer exists. The 10-year Indian Government Securities yield has moved above 7%, reflecting a higher-for-longer rate environment that has materially changed the mathematics of bond investing. When rates rise, existing bond prices fall, destroying the very cushion the 60/40 model was designed to provide.
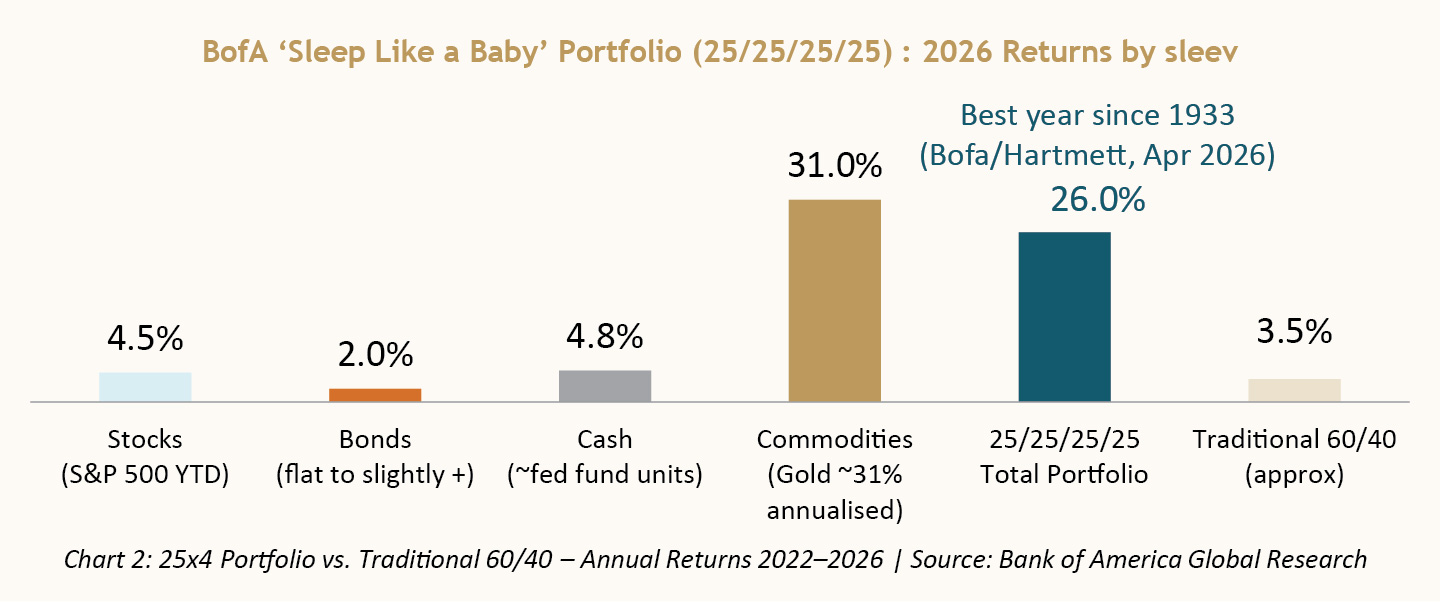
The evidence from global markets is now unambiguous. Bank of America’s research on their “Sleep Well at Night” portfolio, which allocates an equal 25% each to Stocks, Bonds, Gold, and Cash, has produced a ~26% annualised return, outperforming the traditional 60/40 portfolio for the first time since the 1970s. The reason is structural: equal weighting manages both inflation risk and crash risk simultaneously.
Engine of long-term wealth creation. Enter at disciplined valuations for maximum compounding.
Income and duration management. At 7%+ yields, bonds are compelling again after years of suppression.
Rises when real rates fall or geopolitical tensions spike. Dual hedge for Indian HNIs.
Provides optionality when opportunities emerge from market dislocations. Dry powder is power.
THE 25x4 PRINCIPLE: Bank of America data shows that equal allocation to Stocks, Bonds, Gold, and Cash is returning ~26% annualised in 2026 – the first time this model has beaten the 60/40 portfolio since the 1970s. It is the only framework built for simultaneous inflation and crash risk.
According to Nuvama Wealth’s analysis, the Nifty 50 is now trading below 16x forward earnings, compared to a historical median closer to 20x. This is, by any objective measure, a meaningful valuation reset. The question is not whether to buy India. The question is how and when.
Our strong recommendation is against lumpsum deployment. We advocate a systematic investment plan spread over 12 months, deploying capital in tranches. This transforms volatility from an adversary into an ally.
Defence and Aerospace: Multi-decade structural theme with government-backed earnings visibility
Private Sector Banks: Compelling risk-reward after significant derating; credit quality improved
Avoid: High-multiple small-caps and sectors with significant import cost exposure
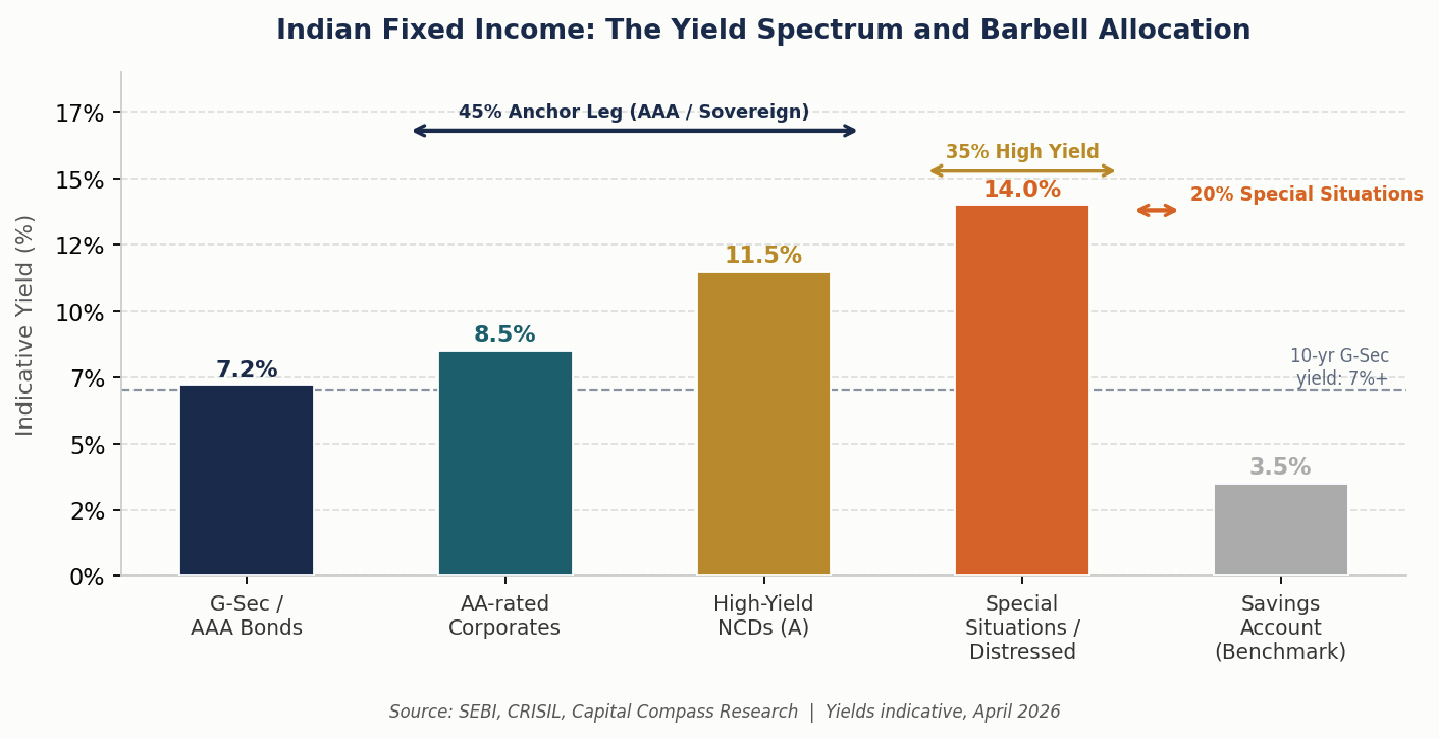
Most HNI portfolios we review carry an excessive concentration in low-yield, overly conservative debt instruments. With the India 10-year yield above 7%, the opportunity cost of this conservatism has risen materially. The Indian high-yield market is currently offering 10-13% yields, which represents a compelling risk-adjusted return when scrutinised with proper credit analysis. We recommend restructuring your debt allocation into a deliberate barbell:
45% — AAA / Sovereign : G-Secs, SDLs, AAA corporate bonds. Safety is non-negotiable. Anchor leg of the barbell.
35% — High-Yield (10–13%) : Investment-grade NCDs, HFC paper, A-rated corporate bonds. Meaningful return premium.
20% — Special Situations : Distressed credit, structured credit, select AIFs. Asymmetric return potential.
The rupee’s structural depreciation trend has accelerated, with the USD/INR rate reaching 95 – a level that would have seemed extreme to many clients even two years ago. Gold serves a dual function in an Indian HNI portfolio: it is a hedge against rupee depreciation and a store of value during geopolitical stress.
Sovereign Gold Bonds (SGB) Long-term portion. Benefits from 2.5% coupon and capital gains tax exemption on maturity.
Gold ETFs Liquidity and tactical allocation. Nippon / HDFC Gold ETF for inflation hedge and geopolitical shock absorption.
International Gold Miners ETF via LRS For clients seeking leveraged exposure to the gold price with global diversification.
RUPEE REALITY CHECK
USD/INR has reached 95. For an Indian HNI with international liabilities, children's education abroad, or a global lifestyle, rupee depreciation is not an abstract risk. Gold and dollardenominated assets are your structural hedge. A 10% gold allocation over the past five years would have added approximately 3–4% per annum to total portfolio returns in INR terms.
A frequent objection from clients during periods of Indian market correction is to reduce international exposure and concentrate on the domestic opportunity. This instinct, whilst understandable, is precisely backwards. The correction has made India cheaper, yes. But it has not made the rest of the world irrelevant.
The FII selling data underscores the structural resilience of domestic flows. Whilst FIIs sold approximately Rs 3.33 lakh crore from Indian markets last year, domestic institutional investors (DIIs) purchased approximately Rs 8.50 lakh crore over the same period. The domestic institutional ecosystem, driven by sustained SIP flows into mutual funds, has proven itself a structural buyer.
For international equity exposure, the conversation in most HNI portfolios we review remains almost exclusively US-centric. This is a mistake. The data on Asian markets tells a story that demands attention.
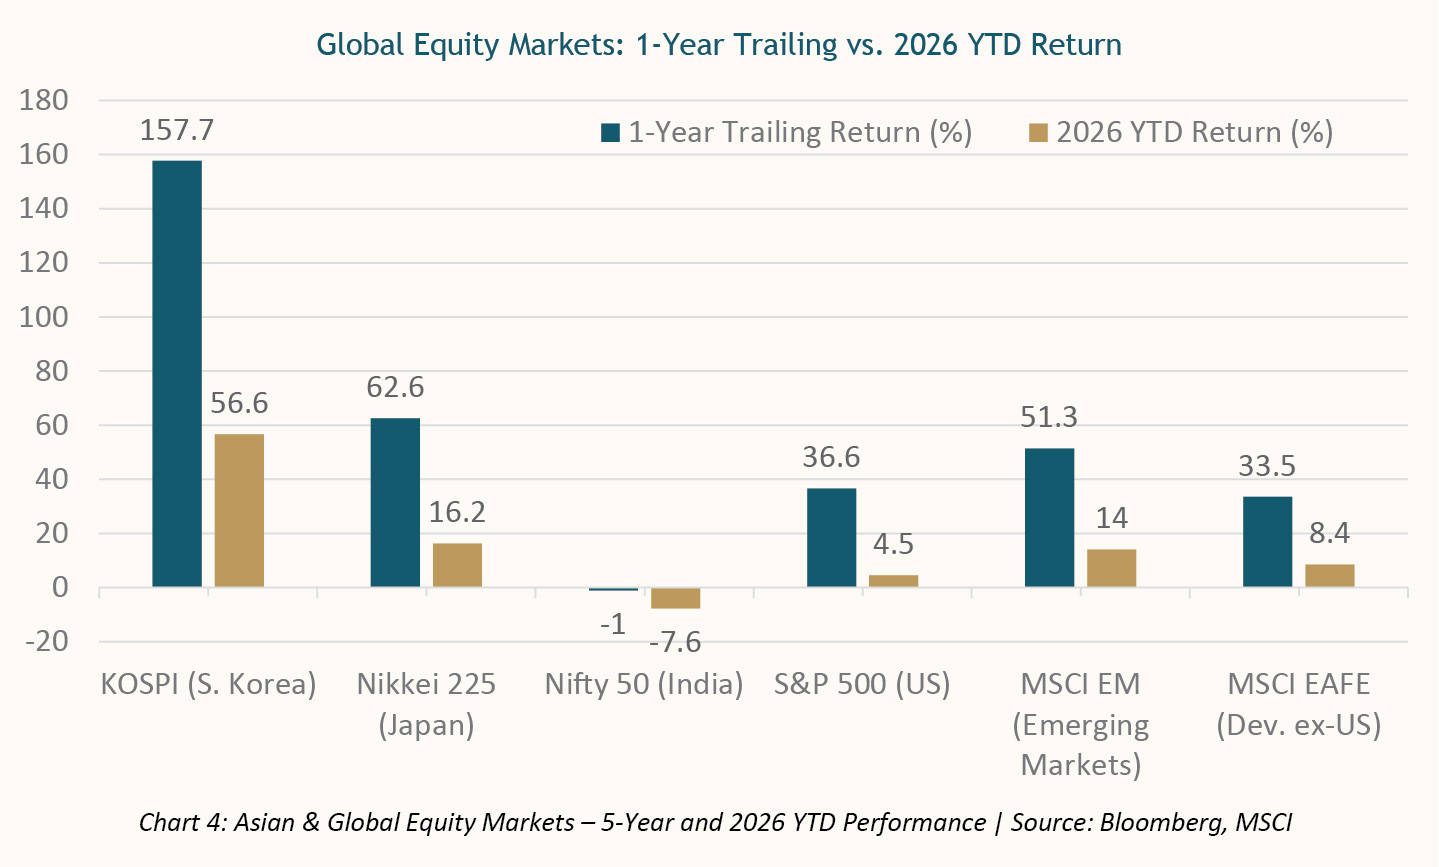
The KOSPI (South Korea) has delivered approximately 38% over five years, and remains one of the most undervalued developedmarket indices globally. Korean conglomerates in semiconductors, shipbuilding, and battery technology are direct beneficiaries of the global supply chain restructuring that is accelerating in the post-tariff era. On a price-to-book basis, the KOSPI trades at a significant discount to both the S&P 500 and European indices, making it one of the most compelling valuation opportunities in global equities today.
Japan’s Nikkei has delivered over 52% over five years in local currency terms. The Bank of Japan’s gradual exit from its ultraloose monetary policy, combined with long-overdue corporate governance reforms, has triggered a structural rerating of Japanese equities. Warren Buffett’s highprofile investment in Japan’s trading houses brought global attention to this theme; the fundamental case remains intact. For Indian investors, a yendenominated allocation via Japan ETFs also provides a currency diversification benefit that is distinct from both the USD and the INR.
Hong Kong’s Hang Seng presents a more nuanced picture, having declined over the five-year period due to regulatory overhangs on Chinese technology companies. However, for clients with a specific mandate to access Chinese consumption and infrastructure themes, selectively managed exposure through specialist funds remains worth considering. We are underweight Hang Seng in the near term but monitoring the regulatory environment closely.
We remain selectively constructive on US equities, but with important caveats. The AI investment cycle has pushed valuations in US mega-cap technology to historically unsustainable levels. We recommend underweighting US Technology and focusing on:
US Financials: Deregulation tailwinds under the current administration, combined with a steeper yield curve, are structurally positive for US banks and insurers. Quality large-cap US financial companies represent a reasonable value proposition relative to their technology counterparts.
US Manufacturing and Infrastructure: The reshoring of manufacturing to the United States is a multidecade secular trend. Companies in industrial automation, energy transition infrastructure, and defence supply chains offer both growth and inflation-hedging characteristics.
Currency as a Tailwind: USD strength vs. INR means international assets purchased today benefit from a natural currency tailwind. Target 15– 20% of total portfolio in nonIndian assets via LRS.
INTERNATIONAL DIVERSIFICATION IMPERATIVE: South Korea (KOSPI) has returned ~38% over 5 years. Japan (Nikkei) has returned ~52%. In a world where FIIs are reducing India exposure, having direct access to these return streams is not a luxury for HNI portfolios. It is a structural necessity. We recommend 15- 20% of the total portfolio in international assets, spread across Asia and the US.
The following table represents our recommended model allocation for an HNI client with a corpus of Rs 5 crore and above, a 5-7 year investment horizon, and a moderate-to-growth risk profile. This is a framework for discussion with your relationship manager, not a one-size-fits-all template. Individual circumstances, existing holdings, tax position, and liquidity requirements must be factored into any final allocation.
| Asset Class | Sub-Category | Allocation | Instrument / Vehicle | Rationale |
|---|---|---|---|---|
| EQUITY (25%) | Indian Large-Cap | 10% | Nifty 50 Index Fund / ETF | Valuation reset at 16x forward P/E – best disciplined entry in 3 years. |
| Indian Sectoral – Defence & Pvt Banks | 8% | Defence PSU ETF, Axis / HDFC Bank Fund | Structural multi-decade themes; margin of safety built in. | |
| International Equity (Asia + US) | 7% | KOSPI ETF, Nikkei ETF, US Financials ETF via LRS | Korea/Japan resilience + USD currency tailwind. | |
| BONDS (25%) | AAA / G-Sec (45%) | 11% | G-Sec, SDL, AAA Corporate FDs | Anchor leg – safety at >7% yield, duration management. |
| High-Yield NCDs (35%) | 9% | A-rated NCDs, HFC paper (10–13%) | Meaningful yield pickup vs risk; credit-analysed only. | |
| Special Situations (20%) | 5% | Distressed Debt / Credit AIFs | Asymmetric return potential; manager selection critical. | |
| GOLD (25%) | Sovereign Gold Bonds | 10% | SGB – tax-efficient on maturity | Rupee hedge + 2.5% coupon; no capital gains tax if held to maturity. |
| Gold ETF | 10% | Nippon / HDFC Gold ETF | Liquidity, inflation hedge, geopolitical shock absorber. | |
| International Gold Miners ETF | 5% | VanEck Gold Miners ETF via LRS | Leveraged gold beta + global diversification. | |
| CASH (25%) | Liquid / Overnight Funds | 10% | HDFC Liquid / Nippon Overnight | Dry powder for dislocation opportunities; T+1 liquidity. |
| T-Bills / Short-Duration Debt | 10% | 91-day T-Bills, 1-year FDs | Capital preservation + competitive yield. | |
| USD Cash / FCNR Deposits | 5% | FCNR deposits in USD/SGD | Currency buffer at USD/INR 95; global optionality. | |
| TOTAL | Fully Diversified | 100% | Equities + Bonds + Gold + Cash | Resilience across all market regimes. |
There is an old market adage that the best time to build a roof is when the sun is shining. We would argue that the second-best time is right now, when the storm has made the need for one impossible to ignore.
The India VIX at 28.90, the Nifty’s correction to 16x earnings, the FII exodus, the rupee at 95 — these are not reasons to retreat. They are, historically, the precise conditions under which the most durable wealth is built. Every significant portfolio constructed during periods of peak anxiety in 1998, in 2008, in 2020, has compounded into something remarkable over the decade that followed. The investors who acted then did not have the benefit of hindsight. They had the benefit of a framework.
That is what this note is: a framework. Not a prediction. Not a promise. A disciplined, evidence-based architecture for navigating a world that has structurally changed — one where the old rules of 60/40, of passive accumulation, of single-market concentration, no longer offer the same protection they once did.
The 25×4 structure does not ask you to be brave. It asks you to be balanced. Each allocation serves a distinct purpose in a portfolio designed for precisely the moments when markets do not cooperate.
Korea’s Semiconductor Renaissance
A structural technology play anchored in global supply chain dominance
Japan’s Governance Rerating
Corporate reform unlocking decades of suppressed shareholder value
Indian Private Banks
Domestic compounders with deep moats and long credit cycle runways
Sovereign Gold Bonds
A real asset anchor providing inflation protection and currency hedge
The quiet power of genuine diversification: it does not need markets to cooperate. It is designed for precisely the moments when they do not.
The clients who sleep well at night are rarely the ones who predicted the correction. They are the ones who were already positioned for it. The window to build that positioning is open right now. We look forward to building it with you.
| Indices | 01-04-2026 | 30-04-2026 | High | Low |
|---|---|---|---|---|
| BSE S&P SENSEX | 73,762.43 | 76,913.50 | 79,367.08 | 71,545.81 |
| NIFTY 50 | 22,899.00 | 23,997.55 | 24,601.70 | 22,182.55 |
| Particulars | AUM As On 28-02-2026 | Fresh Fund Mobilized During March-2026 | Redemption During March-2026 | AUM As On 31-03-2026 |
|---|---|---|---|---|
| Total AUM of all mutual fund schemes | 75.89 | 15.61 | 18.01 | 73.49 |
| AUM of equity oriented (growth) schemes | 31.57 | 0.84 | 0.43 | 31.98 |
Source: Association of Mutual Fund of India (AMFI)
| Month | SIP Contribution (₹ Crore) | SIP AUM (₹ Crore) |
|---|---|---|
| March-2026 | 32,087 | 15,10,943 |
| FII / DII | Gross Purchase | Gross Sale | Net |
|---|---|---|---|
| FII | 3.03 Lakh | 3.74 Lakh | Selling : 0.71 Lakh |
| DII | 3.78 Lakh | 3.27 Lakh | Buying : 0.51 Lakh |